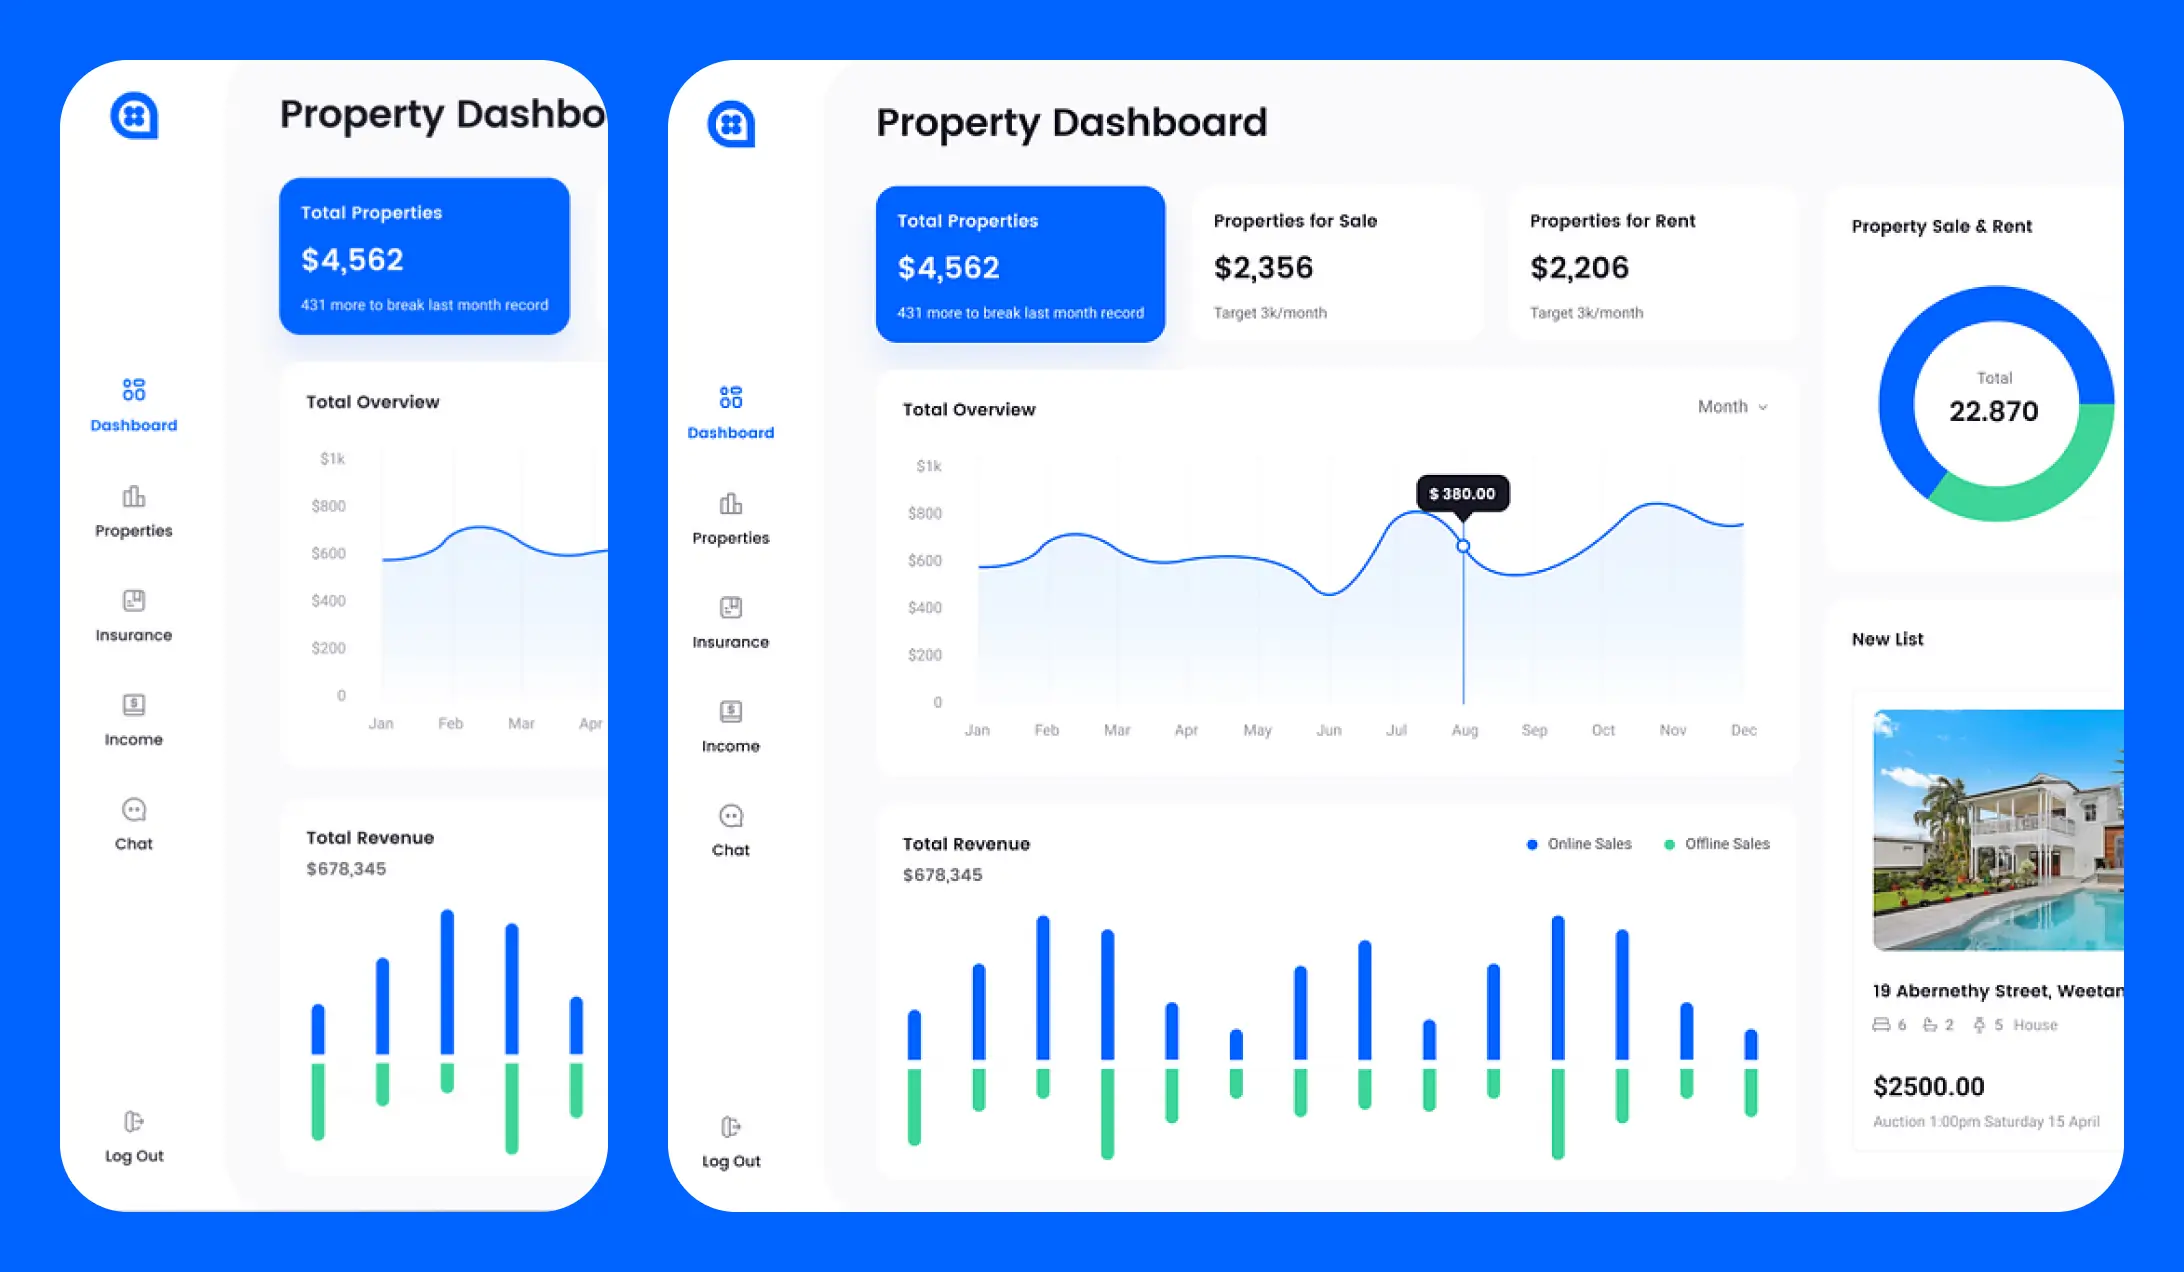
The “Insight360 Analytics Dashboard Project” marks a transformative leap in our client’s data visualization and business intelligence capabilities. The goal was to build an interactive, AI-powered dashboard that empowers decision-makers with real-time insights, KPI tracking, and predictive analytics—all within a clean, intuitive interface.
Our approach focused on blending data science, UI/UX precision, and system integration to create a powerful visualization platform. By transforming raw data into visually compelling stories, we enabled our client to make informed, data-driven decisions faster and more confidently.
From data modeling to interface design, our team delivered an end-to-end solution that simplified complex datasets into actionable insights, boosting operational visibility and strategic alignment across departments
The Insight360 Dashboard Project required developing a unified analytics platform that consolidated data from multiple business systems—including ERP, CRM, and IoT sensors—into one central, dynamic interface.
The dashboard needed to support real-time data streaming, role-based access, and AI-driven insights for executives and operations teams. Our objective was to create a user-friendly dashboard design that simplifies data exploration and ensures accuracy, speed, and visual consistency.
Our team delivered a fully responsive and scalable analytics dashboard that integrates data from diverse sources into one interactive control center. The result is a real-time, data-driven ecosystem that enhances visibility, performance monitoring, and decision-making accuracy across all levels of the organization.
The Insight360 Dashboard has become the client’s core business intelligence platform—bridging data and strategy through design and technology. By integrating AI and automation with user-centric design, we empowered the client to turn complex data into clear, actionable intelligence.